Lynch River Bridge Replacement
Challenge:
The Lynch River Bridge in Florence, South Carolina is one of among many bridges being replaced by the South Carolina Department of Transportation (SCDOT). The design for the 63-year-old bridge included the use drilled shafts to support the structure’s main piers. Project specifications required a two-level Bi-Directional Static Load Test (BDSLT) on a 60-inch diameter test shaft. The purpose of the load test was to determine mobilized shaft, base, and total resistances from two jack assemblies installed within the non-production test shaft.
Method:
The shaft head and shaft base were located at elevations 123.4 and 17.4 feet respectively (total concreted length below ground surface of 106.0 feet). A 40.2-foot cased section (66-inch diameter casing) was followed by a 65.8-foot uncased section (60-inch nominal diameter shaft). This multi-level BDSLT shaft contained two jack assemblies at elevations 39.4 and 19.4 (84 and 104 feet, respectively below the shaft head). Each jack assembly was constructed with a single 1550-ton GRL-Cell welded between two bearing plates. The reinforcing cage was instrumented with 11 levels of sister-bar strain gauges (two gauges per level) – eight levels above the mid-range jack assembly and three levels between the jack assemblies. Four vibrating wire displacement transducers were welded across each jack assembly to measure jack expansion. A total of twelve telltales were used to assess the displacement of the upper and lower bearing plate on each jack assembly. Two digital survey levels recorded shaft head displacement. While the length of shaft combined with two jack assemblies required a significant amount of instrumentation, it also required detailed organization and planning. Hydraulic hoses and instrumentation cables were threaded through the mid-range jack assembly and protected from concrete during the pour and cell expansion during the test. An additional challenge was determining the proper amount of welding and bracing of the cage to withstand lifting and placement, while still allowing the welds to break easily when it came time to apply loads.
The Shaft Area Profile Evaluator (SHAPE®) was used to evaluate the shaft dimensions within the drilling fluid as well as the verticality of the overall excavation. The Shaft Quantitative Inspection Device (SQUID™) was used to assess the shaft bottom cleanliness prior to concrete placement. Sediment and/or debris thickness was evaluated at five locations at the base of the shaft. Thermal Integrity Profiling (TIP™) was used to assess concrete quality and the effective radius based on relative curing temperatures and volume of concrete. The test shaft was instrumented with five Thermal Wire® cables. Crosshole Sonic Logging (CSL) tubes was also performed by others. TIP and SHAPE results in conjunction with plan drawings and installation logs were used to determine the cross-sectional area of the shaft at specific locations for the BDSLT analysis.
With two jack assemblies targeting resistance in different portions of the test shaft, this BDSLT consisted of three stages of testing over two days.
- Test Stage 1 consisted of pressurizing the lower-level jack while the mid-range jack remained welded closed.
- Test Stage 2 consisted of pressurizing the mid-range jack with the hydraulic lines to the lower-level jack open, allowing the lower-level jack to drain and retract.
- Test Stage 3 consisted of pressurizing the mid-range jack with the hydraulic lines to the lower-level jack closed, rendering the lower-level jack locked (unable to drain).
Results:
GRL analyses included average measured microstrains to compute internal force (using the Incremental Rigidity method) and segmental displacements. An equivalent top loading (“ETL”) curve was constructed using the load transfer method. All analyses related to the ETL curve construction were performed using the TZPILE software (Version 2014.3.6) developed by Ensoft, Inc. The ETL analysis incorporated mobilized unit shaft resistance (i.e., t-z curves) and total base resistance (i.e., Q-z curve) from the various test stages. The base resistance computed from Test Stage 1 was utilized along with the unit shaft resistance between jack assemblies from Test Stage 2 and the unit shaft resistance above the mid-range jack assembly from Test Stage 3.


Project Details
Client: United Infrastructure Group, Inc.
GRL Office: North Carolina
GRL Services
- Bi-Directional Static Load Testing
- Drilled Shaft Verticality Assessments
- Drilled Shaft Bottom Cleanliness Evaluations
- Thermal Integrity Profiling
- Crosshole Sonic Logging
-

- Figure 1. Upper and Lower Bearing Plate Displacement vs Gross Test Load
-
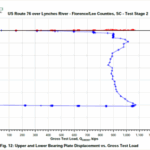
- Figure 2. Upper and Lower Bearing Plate Displacement vs Gross Test Load
-

- Figure 3. Upper and Lower Bearing Plate Displacement vs Gross Test Load
-

- Figure 4. Equivalent Top-Loading (“ETL”) Curve