Sand Island Wastewater Treatment Plant
Challenge:
The city of Honolulu embarked on an expansion of the Sand Island wastewater treatment plant to account for residential growth. The $180.5 million expansion included construction of a second digester at the facility, as well as raising the facility to account for rising sea levels. Hawaiian Dredging Construction Company engaged GRL Engineers to provide foundation testing services, including Bi-Directional Static Load Testing and Thermal Integrity Profiling of augered-cast-in-place piles (ACIP).
Method:
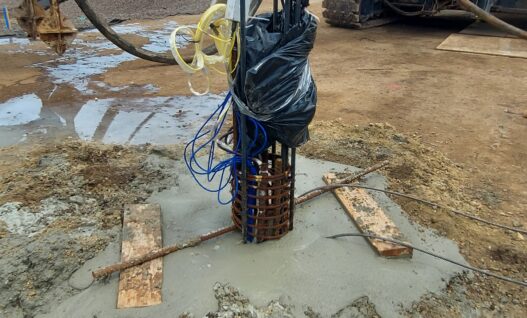
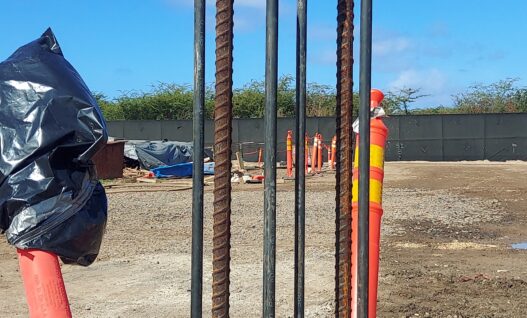
GRL tested an ACIP pile that was installed 72 feet below ground surface with a nominal diameter of 18 inches. The Bi-Directional Static Load Test (BDSLT) was requested to determine the mobilized shaft, base, and total resistances from a single GRL-Cell installed within a non-production pile. The jack assembly consisted of a single 350-ton GRL-Cell with associated displacement instrumentation. The pile was drilled, grouted, and then the 66.2-foot-long reinforcing cage installed into the excavation. The instrumented reinforcing cage terminated at a depth of 64.9 ft, resulting in a cage stick-up of 16 inches above ground level. The BDSLT was performed seven days after installation.
Thermal Wire® cables were also instrumented on the ACIP test pile to determine the Effective Radii over the instrumented length of the pile and to better ascertain the grout quality surrounding the GRL-Cell. Two Thermal Wire cables were attached along the reinforcement cage. Following the placement of the reinforcement cage in the grout filled excavation, a TAP-Edge and TAG were attached to the Thermal Wire cables and data acquisition was initiated. Every 15 minutes, the TAP-Edge and TAG devices automatically record the measured temperature at each sensor location, generating a profile of temperature vs depth at each increment of time.
Results:
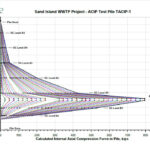
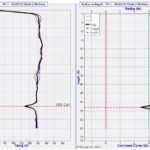
The BDSLT results are provided in Figures 1 through 4 below. Figure 1 depicts the so called butterfly plot which indicates that at the 800 kip maximum loading the top of the BDSLT jack had moved about 0.6 inches while the bottom displacement was approximately 0.7 inches. Figure 2 provides the measured internal forces along the pile length as derived from the embedded strain meters.
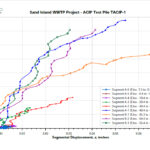
Full mobilization of shaft resistance was not exhibited at most evaluated pile segments above and below the jack assembly. Maximum mobilized shaft resistance was 15.5 ksf at approximately 0.05 inches of segmental foundation displacement on Segment A1. The t-z curves above and below the jack assembly are presented in Figure 3.
Negligible internal force and mobilized resistance at the pile base was indicated by the internal force profiles in the lowest pile segment. An equivalent top loading (“ETL”) curve was constructed using the modified method and is presented in Figure 4. For an equivalent top load of 1,501 kips, pile head displacement is estimated to be approximately 0.32 inch.
The TIP results are presented in Figures 5 and 6. Figure 5 presents the Measured Temperature (degrees Fahrenheit) vs. Depth (ft) on the left plot, and the Estimated Effective Radius (in) vs. Depth (ft) on the right plot. Temperature roll-off at the top of a pile is caused by heat loss due to the grout / air interface. It should be noted that the Effective Average Radii reduction computed at the location of the jack assembly is due to the amount of steel at this elevation which acts as a heat sink. Figure 6 presents the Estimated Effective Radius and a 3D model of the pile where adjustments in the temperature profile were applied to compensate for the temperature reductions at the jack assembly location.
Based on the thermal results, the Effective Average Radius is generally greater than the nominal 18-inch-diameter pile along the instrumented pile length. Please note that the reduction observed near the pile top may be due to grout settling after placement or the presence of lower quality grout in this region.
Project Details
Client: Hawaiian Dredging Construction Company, Inc.
GRL Office: Hawaii
GRL Services
- Thermal Integrity Profiling
- Bi-Directional Static Load Testing
-

- Figure 1. Top and Bottom of Jack Assembly Displacement vs Test Load
-
- Figure 2. Internal Force vs Elevation
-
- Figure 3. Average Segmental Unit Shaft Resistance vs Segmental Displacement (t-z)
-
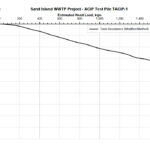
- Figure 4. Equivalent Top-Loading (“ETL”) Curve
-
- Figure 5. Measured Temperature vs Depth (left) and Estimated Radius vs Depth (right)
-
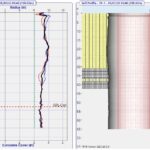
- Figure 6. Estimated Radius vs Depth with Mid-Shaft Adjustments Applied at the Jack Assembly (left), 3D Interpretation (right)