I-480 Valley View Bridge Pile Test Program
Challenge:
The widening of the I-480 Valley View Bridge was a design-build project for the Ohio Department of Transportation (ODOT), with Walsh Construction as team lead and general contractor, and Jacobs as lead designer. The design-build team chose to develop a design-phase pile test program to quantify the soil setup and include those findings into the final pile design.
The goal of the program was to justify a high geotechnical resistance factor, quantify “long-term” setup to be incorporated into the design of production piling, and to provide reliable estimates of pile quantity.
Method:
Initial drive testing was performed on each test pile with a target capacity of approximately 650 kips. The anticipated pile capacity following soil setup was approximately twice the initial drive target. Short-term restrikes were performed to assess the relationship of soil setup and waiting time so that future restrike decisions could be made.
Static load tests were instrumented with 12 to 15 vibrating wire strain meters used to evaluate shaft resistance distribution and end-bearing soil resistance. The static load tests were performed 39 to 43 days after pile installation.
CAPWAP analyses were performed to assess the resistance distributions from the dynamic and static load test piles. Long-term restrikes took place between 26 and 56 days after installation. A 56-kip drop weight (GRL’s APPLE IV system) was used to perform long term restrikes. Using the drop system allowed full mobilization of the soil resistance during the restrike testing.
Results:
The initial drive testing indicated substantial variation in driving behavior and soil resistance at the end of driving. Relatively hard soil layers on the Western side of the proposed bridge alignment provided significant end-bearing resistance, with end-of-drive soil resistances ranging from 420 to 830 kips. The relatively hard layers were absent on the Eastern side where the end-of-drive soil resistances ranged from 234 kips to 502 kips. Large pile rebound was observed during driving at some locations due to high plasticity soils at the pile toe and increased pore water pressures. This resulted in high blow counts from increased dynamic resistance, but relatively low static resistance.
Short-term restrike results indicated significant increases in soil resistance over a relatively short time-period. The amount, and rate, of short-term soil setup was variable, however the magnitude of the setup is as high as 4 times the initial drive shaft resistance after one day, and 6 times higher after 7 days.
The static load tests provided up to 2000 kips. Geotechnical failure of the SLT piles occurred for two of the three piles presented below, while one SLT pile was loaded to the maximum load without failure. Figure 1 depicts the load vs pile head displacement curves for all three static load tests. CAPWAP analysis for the long-term restrikes incorporated the results from the static load tests. The values from the t-z curves and internal force profiles were used to refine the resistance distribution in the analyses. For test piles at piers where a static load test was not performed, the resistance distribution was adjusted based on the force and velocity curves, but general trends in the resistance distribution were similar. The results from the instrumented static load tests indicated higher than anticipated unit shaft resistance values which were also present in the CAPWAP analysis.
Once the CAPWAP analyses were completed for initial driving and restrikes, soil setup profiles were generated to quantify the amount of soil setup vs. depth. These profiles can be viewed in Table 1.


Project Details
Client: Ohio DOT & Walsh Construction
GRL Office: Ohio
GRL Services
- High Strain Dynamic Testing
- CAPWAP® Analyses
- Static Load Testing
- Long-Term Restrikes
-
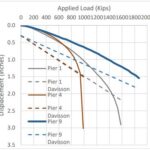
- Figure 1. Applied Load vs Pile Head Movement for Three Static Load Tests
-
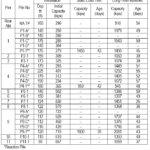
- Table 1. Results from Design-Phase Pile Test Program